Passive Equity Portfolio: Annual Report

Let’s get to the ugly truth. Since inception (July 2014), my passive portfolio is up only 2.18%19 times less than the market return during the period. For 2017, the portfolio returned only 3.82%, 6 times less than the market return. Um….um….um, let me try to justify the low returns.

My peers and people jealous of me would be laughing like this:
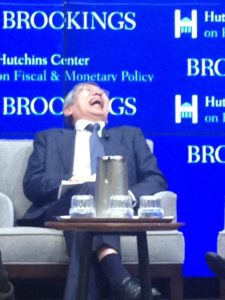
Kuroda’s evil laugh
2014-2015

When I opened the account in the summer of 2014, TD Ameritrade gave me 2 months to trade for free. So during that time, I wanted to fill the account with stocks. The only problem was I did not know which stocks to buy. At the same time, I did not know how to research potential investments.

Mostly guided by “expert” recommendations and positive headlines, I bought some stocks which destroyed my portfolio, including Ford (F), J.C.Penny (JCP), Cisco (CSCO), General Electric (GE), and General Motors (GM). In 2015, I still did not know which stocks to buy. I wanted to do my own research. I decided to research all the stocks that were bought the previous year.

From my research, I found CSCO, GE, and JCP attractive. So I decided to keep them in the portfolio. I even wrote about CSCO and GE on the blog. I did not write on JCP as I was not profoundly convinced. Funny thing is I have never shopped at JCP, just at its competitors. Even my mother did not like J.C. Penny.

I did not like F, yet I decided to keep F in the port because it was not worth getting rid of them at $10 commissions. For GM, I was on the fence. In addition to these names, I decided to research new names and bought some of them. 70% of my portfolio was in cash in January of 2015. In December, it was 42%.

The new stocks I bought in 2015 were non-dividend yielding risky names, such as Bellatrix Exploration (BXE), Twitter (TWTR), and GoPro (GPRO). All of which did not work out well to this day. BXE, because I tried to find a good energy company at the time every energy companies were distressed. I’m very active on Twitter and use GoPro most of the time. So I wanted to invest in them. At that time, I thought Twitter would get acquired, and GoPro management would start to turn things around, and the Karma Drone would be positive for the company’s financials.

2016-2017

In 2016, I continued to research new stocks. However, I did not invest in any of them. I deposited more money into the account during that year. At the end of 2016, 82% of the portfolio was in cash.

I always found real estate interesting. Used to read about them. My interest in the real estate market skyrocketed after my first ever internship, at a small real estate firm. In January of 2017, I decided to buy WPC, a Real Estate Investment Trust (REIT). During the year, I also bought Verizon (VZ). I did not want the remaining cash in the port to sit idle. So I decided to purchase free commission based short-term bond funds, very stable dividend yielding cash parking (and one high-yield ETF). At the end of 2017, 17% of the port was in cash.

Over the past month, I have been researching consumer goods companies. I’m looking to add one to the port. When I do, I will be sure to write about it.

10 Equities

I’m currently holding 10 companies; CSCO, GE, GM, BXE, WPC, JCP, F, TWTR, GPRO, and VZ.

All shares of 10 different companies belong to 1 class: domestic equity. 62% are in large cap., and 38% are in mid-cap.

On February 16, 2015, I recommended going long Microsoft (NASDAQ: MSFT) when the share price was $43.95. Since then, it is up 101%*. I made a mistake of not buying when I wrote about it. “Put your money where your mouth is, Khojinur.”

On April 12, 2015, I recommended going long General Electric (NYSE: GE). Since then, GE is down 33%*. Dividends are automatically invested in new shares. Average price I paid for the shares is $26. I’m down 29%. Despite the 50% dividend cut recently, I’m staying with the stock for two reasons. The cost-cutting will be the best bet for us the shareholders. The $7 commission fee won’t be worth it, especially since the stock was bought in 2015 when I had less money. If I can open second Robinhood account, I’ll transfer from Ameritrade to the free-commission based brokerage.

In the summer of 2015, I wrote about CSCO (part 1part 2 AND 4Q FY’15 earnings report). Since the first article, the networking giant is up 44%*. Average price I paid for the shares is $25.11. I’m currently up 57%.

On November 21, 2015, I wrote my first article on LLY and believed it was overvalued (it still is). Since then, the pharmaceutical company is up a mere 1.25%*. The second article on LLY was posted a year after the first article. I personally am not short the stock as I cannot short.

On December 26, 2015, I recommended going long GoPro (NASDAQ: GPRO) and believed it was a buy. Since then, the action camera maker and I are down whopping 59%.

On May 2, 2016, I recommended holding FireEye (NASDAQ: FEYE).  Since then, the cybersecurity firm is down 15%.

On January 20, 2017, I recommended going long W.P. Carey (NYSE: WPC). Since then, the REIT is up 11%*. Average price I paid for the shares is $61.44. I’m currently up 10%.

On May 9, 2017, I recommended going long Verizon (NYSE: VZ). Since then, the telecom is up 46%*. Average price I paid for the shares is $46.05. I’m currently up 47%.

*dividends not calculated

Estimated the portfolio dividend yield is 2.48% (that is very similar to the 10-year yield), with largest being 6% and lowest 0%. I plan to increase the portfolio dividend yield by getting rid of non-dividend yielding stocks and/or buying dividend-yielding stocks. That will happen fast, if I can make second Robinhood account and transfer the portfolio to there.

When I started doing research in-depth and writing down my findings and thoughts, everything started to improve. Writing is powerful!

Every new trade and investment will first be announced on Twitter. Almost always!

Active Equity/Commodity Portfolio: Annual Report

Happy New Year! I have no resolutions since every day is like a new year for me.

In 2017, I focused more on active equity/commodity portfolio than the other portfolios as I finally was able to trade free of commissions, found more opportunities there and had money saved up from off-book jobs.

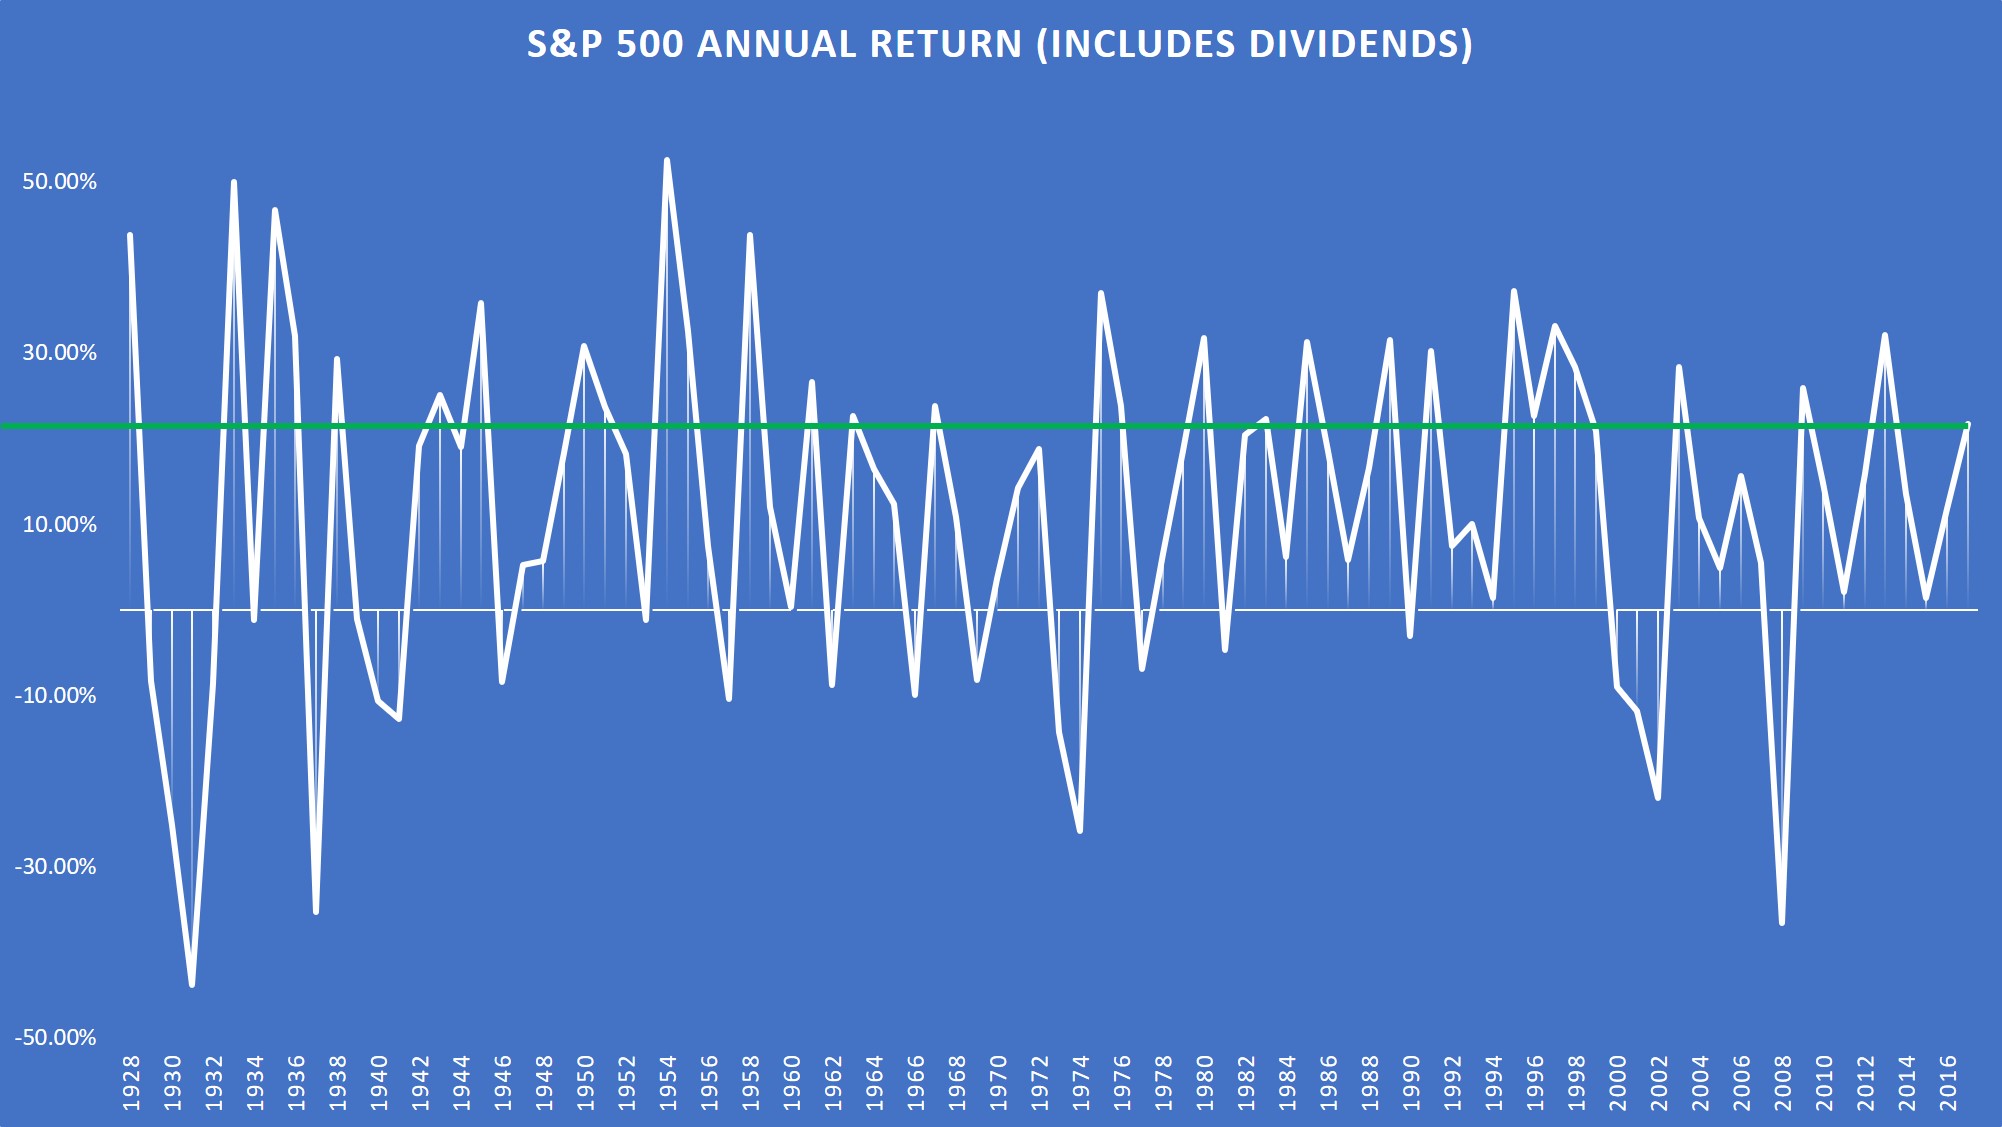
WHAT A BORING YEAR…for the stock market. Sometimes, boring is good. S&P 500 was up 21.64%.

Figure 1: S&P 500 Annual Return (Includes Dividends).
Source: Aswath Damodaran, NYU Stern

The geometric average return since the financial crisis is 8.42% (2008-2017). Geometric average better reflects the returns over time since there’s always volatility in the market and volatility lower investment returns.

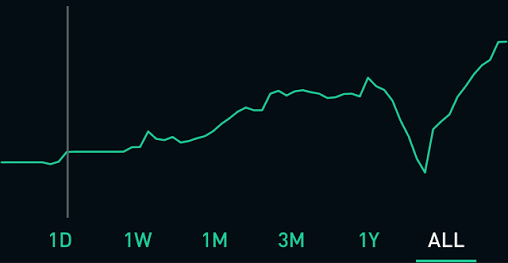
Since inception (November 2016), active equity/commodity portfolio is up 15.74%. For 2017, the portfolio returned 11.86%, way way below the market. No wonder active managers are not anyone’s favorites at this time.

Figure 2: Active Equity/Commodity Portfolio (Robinhood) P/L since inception (Nov. 2016).
The white line represents the start of the year.

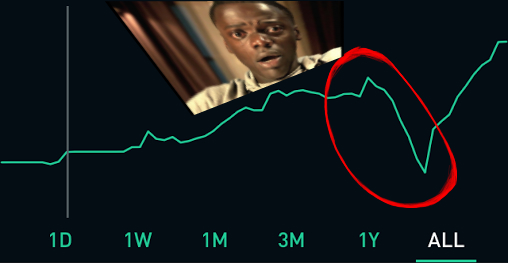
I will address the significant drawdown you see in figure 2 at the bottom of this post.

The biggest gain of the year, both in a percentage and nominal terms, came from the first trade in 2017. The trade was long NUGT (3x leveraged gold ETF). I believed gold was unfairly beaten down and would recover around the new year as portfolios would be rebalanced and uncertainty with Trump’s economic plans at the time would force investors to hedge their portfolio. And that’s what happened in January 2016. I closed the position at 28% gain.

While trading 3x leveraged ETFs, Be cautious as they always go down even though the underlying security goes up. The structure of leveraged and inverse ETFs are different than most retail investors think. They are not a good idea to be held for a longer time and as a significant portion of a portfolio.

The biggest loss of the year, both in a percentage and nominal terms, came from the 5th trade in 2017. The trade was long TVIX (2x leveraged volatility ETN, not ETF). I believed volatility would pick up from February to March (and it did a little bit). However, after TVIX underwent 1:10 reverse split in mid-March, I did not want to risk having the ETN go to single digits once again. So I closed the position at 17% loss.

To briefly sum up, the biggest gain was 28% and the biggest loss was 17%. In positive nominal terms, the profit was three times larger than the loss (positive number).

At the time, both NUGT and TVIX were a significant portion of the portfolio (Robinhood). Over time, I deposited more money into the account as I saved up from off-book jobs and summer internship. The account is now 6 times larger than it was at the beginning of 2017. Larger account allowed me to have more flexibility and lower my exposure to a single trade.

Top 3 Trades and Bottom 3 Trades
Current Positions:

I can only go long securities on Robinhood. Current positions are VRX (The biggest gainer at the moment, 112%. 14% of the portfolio), ORCL, XIV, ILMN, OMER, PSQ, SH, COL, TEVA, MTSI, and AXON (The biggest loser at the moment, -77%. 0.5% of the portfolio).

When talking about % gains on trades, traders should also look at those trades as a % of the portfolio. If I’m going to speculate on a one-time event, such as FDA ruling on a drug, I’m going to have a small exposure to that company (such as AXON). If I am profoundly convinced on the fundamentals of the company and/or technicals of the stock, I will have a higher exposure to that company (such as VRX).

It’s important to point once again these gains/losses are unrealized. The returns are subject to change…until the position closes.

Both PSQ and SH are inverse ETFs of the market. I have bought them as a small hedge for my portfolio as I’m long individual U.S. stocks.

Why am I long the stocks mentioned above? I will not go in-depth here.

  • $VRX: Extension of debt. Time flexibility to restructure the company.
  • $ORCL: Unfair share-price beat down after positive earnings report and market, in general, is trending higher.
  • $XIV: Because why not?
  • $ILMN: Someone is loading up big amounts of calls. Speculation it will be acquired at a huge premium.
  • $OMER: Friend’s advice (first time I took friend’s advice with actual money at risk).
  • $PSQ and $SH: Small hedge, as I mentioned above.
  • $COL: Speculated it might be acquired at 15-25% premium. United Tech (UTX) later acquires them at 18% premium.
  • $TEVA: TEVA calls were active after Allergan (AGN) was halted. Speculated upcoming positive news for TEVA. The week after, new CEO news. Sticking to TEVA as the new CEO has a great reputation and I’m confident his tenure will reward the shareholders.
  • $MTSI: Calls active and social media sentiment.
  • $AXON: Speculation on Alzheimer drug data. Chances were low, but I believed even a small positive side of the drug would help the stock price. I was wrong. Was initially 2% of the portfolio. Now 0.5%. Still open as I have nothing to lose.
Get Out?
Over 12% loss of value in less than 2 months (Fall 2017).
The face is from the movie “Get Out

As you saw in figure 2 (and figure 3 below), there was a large drawdown in the portfolio. Over 12% of the portfolio lost value in less 2 months. Why was that? It was largely due to VRX and TEVA tumbling. Both were little longer-term strategy and high conviction both companies would turn itself around. After 2 months, both stocks rebounded and hit 52-week highs afterward. Other stocks in the port during the 2 months were performing fine.

If it is one thing I learned as a trader, it is that high conviction leads to an ego which then leads to losses most of the time. So did I have an ego in this case? I don’t believe so. I was sticking to the initial trade strategy on VRX and TEVA, and there was no material news. It was the market noise. If the company fundamentals changed, then I might have changed my strategy on the trade (either close, cut down, or buy more shares).


Upcoming ‘Portfolio Performance’ articles will be on other portfolios.

The Importance of Downside Protection

Big-Risk = Big-Return is true for individual securities. But not for a portfolio. A common misconception for investors (and traders).

Risk-Reward has a positive correlation, but it’s not perfect.

Risky securities are diversifiable by lower correlated/negative correlated securities. By buying low correlated securities to hedge your risky security, are you lowering your upside? No. You’re lowering your downside.

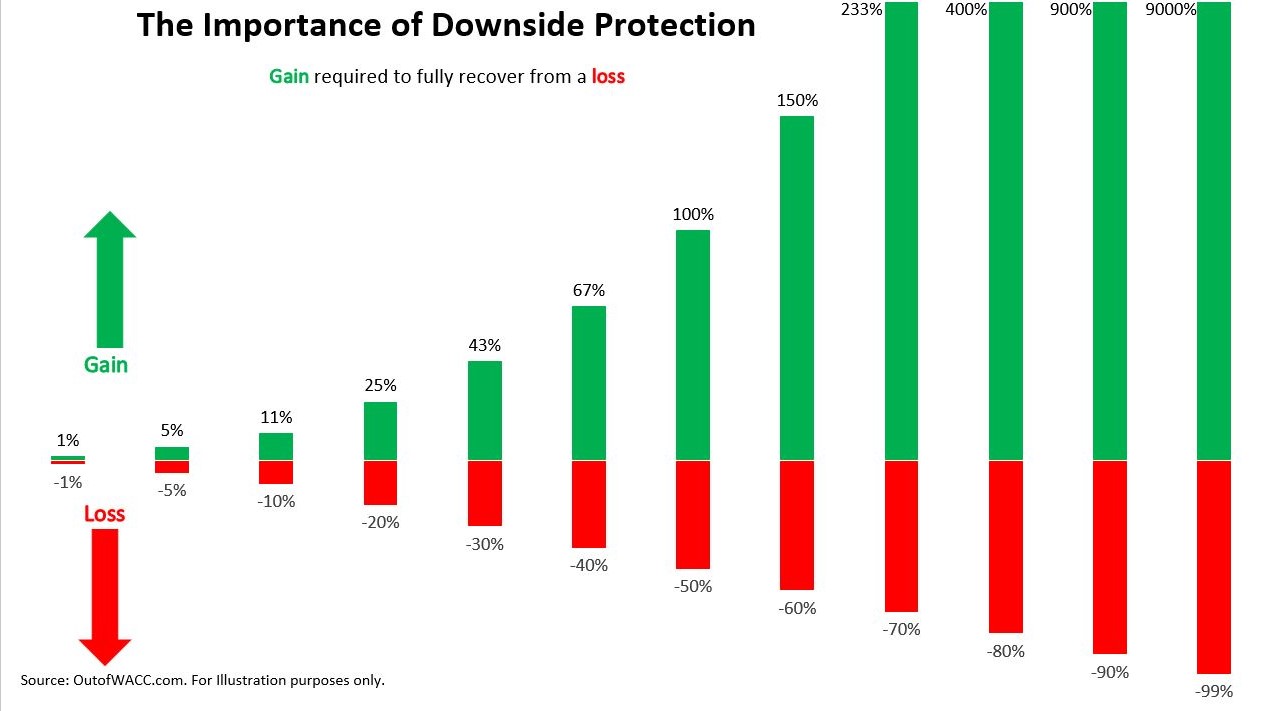
For investors, capital preservation is more important than the growth of capital. The bigger the investment loss, the greater the gain required to break even. A 20% investment loss requires a 25% gain to get back to the initial investment value. Whereas a 40% loss requires 67% and 70% loss requires 233%. The best offense is a good defense.

The Importance of Downside Protection

If you invest $10,000 in S&P 500 ETF and a recession causes the market to drop 30%, the $7,000 value would need to gain 43% to get back to $10,000.

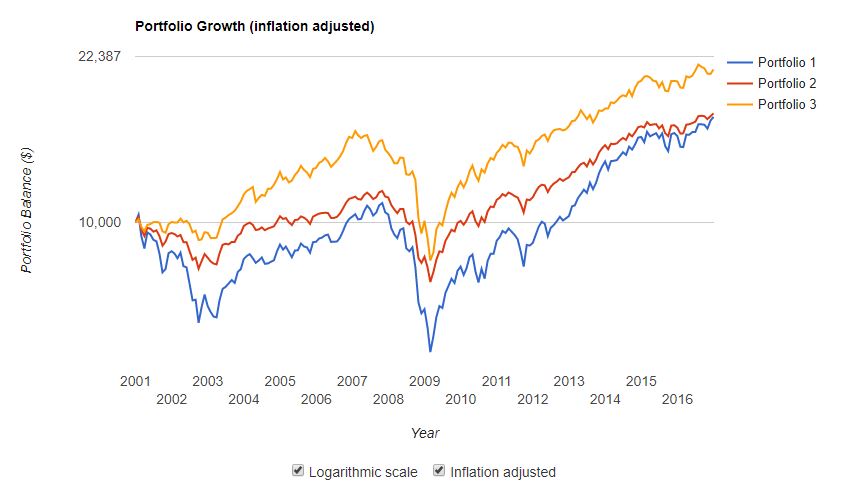
Let’s look at the following 3 portfolios, each with a different strategy:
  • Portfolio 1 is invested 100% in S&P 500 (SPY).
    • SPY’s annualized standard deviation is 15%.
  • Portfolio 2 is invested 60 and 40 in S&P 500 (SPY) and Investment Grade Bond Fund (FBNDX).
    • Both are 0.31 correlated, based on annual returns.
    • FBNDX’s stdev is 4%.
  • Portfolio 3 is invested 33.34%, 33.33% and 33.33% in S&P 500 (SPY), Investment Grade Bond Fund (FBNDX) and U.S Real Estate ETF (IYR), respectively.
    • IYR is 0.69 correlated to SPY. 0.63 correlated to FBNDX. Correlation is based on annual returns.
    • IYR’s stdev is 21%.

* I initially wanted to backtest them for 30 years, but since IYR was the only real estate ETF I could find with the earliest fund inception date (June 2000), the backtest is from Jan 2001 to Dec 2016.

** Link to the data above can be found here.

Each portfolio is rebalanced annually. Dividends and distributions are reinvested. Taxes and transaction fees are not included.

Here’s the growth of each portfolio over the past 16 years.

3 Portfolio Backtest (Inflation Adjusted). January 2001 – December 2016
  • Port 1 has returned annual growth rate of 3.26%, after inflation.
  • Port 2 has returned annual growth rate of 3.36%, after inflation.
  • Port 3 has returned annual growth rate of 4.75%, after inflation.

Portfolio 1 and 2 have very similar returns. However, the traditional 60/40 portfolio (port 2) took much less risk than all-in portfolio (port 1).

Port 2 had a maximum drawdown of 35% while port 1 had 51%. Portfolio 2’s standard deviation (9%) was almost half the stdev of portfolio 1 (15%).

Port 3, on the other hand, had 45% max drawdown with a standard deviation of 11%, both in the middle of port 1 and port 2. However, they returned much higher.

3 Portfolio Backtest. January 2001 – December 2016. The “Final Balance” and “CAGR” numbers you see above are not inflation-adjusted.

Also, port 3’s Sharpe ratio, Sortino ratio, and Treynor ratio are all higher than the other two.

There are a lot of things to look at when determining which portfolio might be the best for a long-term investor. My favorite is portfolio 3, although the volatility is higher than portfolio 2. REITs (in port 3) provide a strong portfolio diversification with lower exposure to market volatility and attractive dividends.

You can see the backtest here for yourself.

Investors vs. Mr. Market

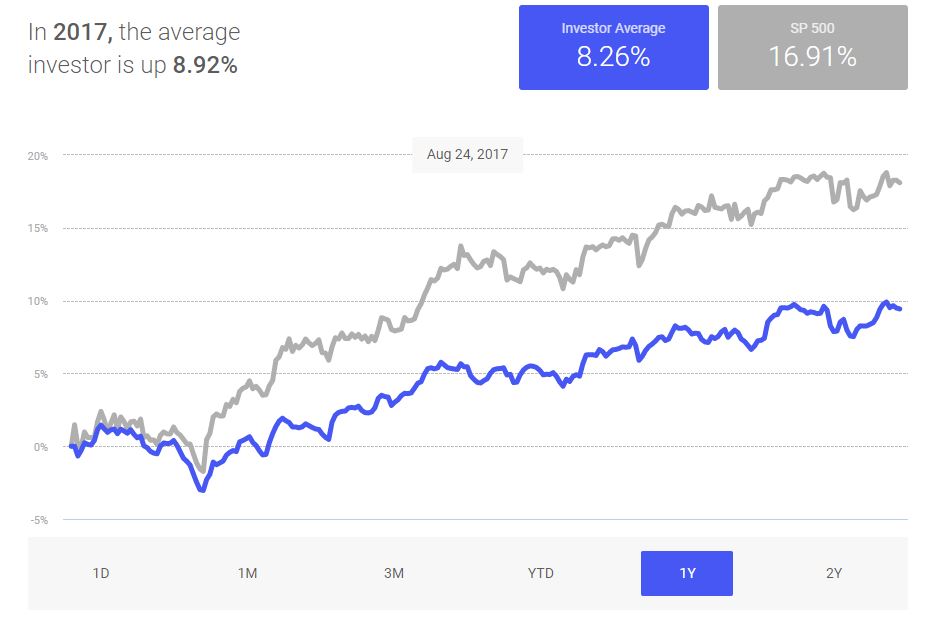
Downside protection strategies may help prevent investors from their bad habits of overreacting to downside volatility and incorrectly timing the market, missing the boat of high returns. Over the past year, S&P gained 18.10% while an average investor gained half of the growth.

S&P 500 vs Average Investor Return.
1-Year up to September 8, 2017.
Source: Openfolio

If you are a passive investor, consider downside protection strategies to limit volatility and build wealth over the long-term.

Diversify portfolio with:

I endorse the idea of employing a multi-asset strategies that lower the downside potential while increasing the upside potential or even decreasing the upside potential less than the decrease in the downside potential.

I am not saying you should allocate your portfolio to every asset there is. It depends on your goals, lifestyle, risk preferences, your responsibilities, the investment % of your overall capital, etc etc etc.

How you allocate each security is up to you (or your financial advisor), or me me me me.

No portfolio is risk-free, but minimizing the downside can help mitigate the pain inflicted by market “fire and fury” and a changing risk landscape in globalization era.

If you have any questions/comments/suggestions, feel free to contact me personally and/or leave a comment below.

PS: Maybe make Bitcoin/Ethereum/Litecoin 5% of your portfolio.

PS: Active traders should also minimize the downside risk, especially if you work, have school, etc.

PS: Never mind. Thank you for reading. Don’t forget to subscribe.

War is Good for the Cold-Hearted Stock Market

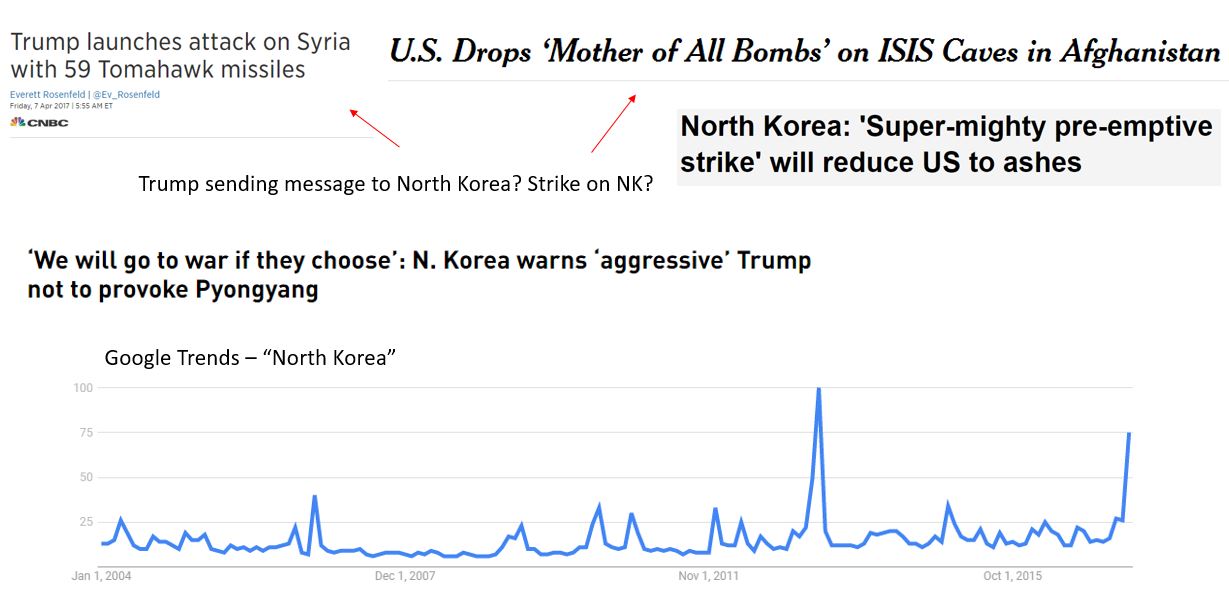
Look at the headlines.

Figure 1: Trump Military Headlines. Google Trends – “North Korea”

At 17-years-old, Donald Trump was named a captain for his senior year at a military boarding school. Spending five years at New York Military Academy, the school taught Trump to channel his aggression into achievement.

Under the Trump budget, almost every budget increase goes to military departments, 10% increase Y/Y in the budget for military spending. It’s not a rocket science to figure out Trump madly loves force.

Even Trump’s Secretary of Defense loves force. Mad Dog James Mattis once said, “It’s fun to shoot some people. I’ll be right up there with you. I like brawling.”

At his confirmation hearing in January, Mattis said, “My belief is that we have to stay focused on the military that is so lethal that on the battlefield, it is the enemy’s longest day and worst day when they run into that force.”

Then there came 59 Tomahawk missiles to military bases in Syria and “Mother of All Bombs” on Daesh tunnels in Afghanistan. All of those came during the heightened tensions with North Korea.

War is Good for the Cold-Hearted Stock Market

North Korea acting out is a good thing for America. War throughout the history has made us united. Not to mention that the stock market goes up.

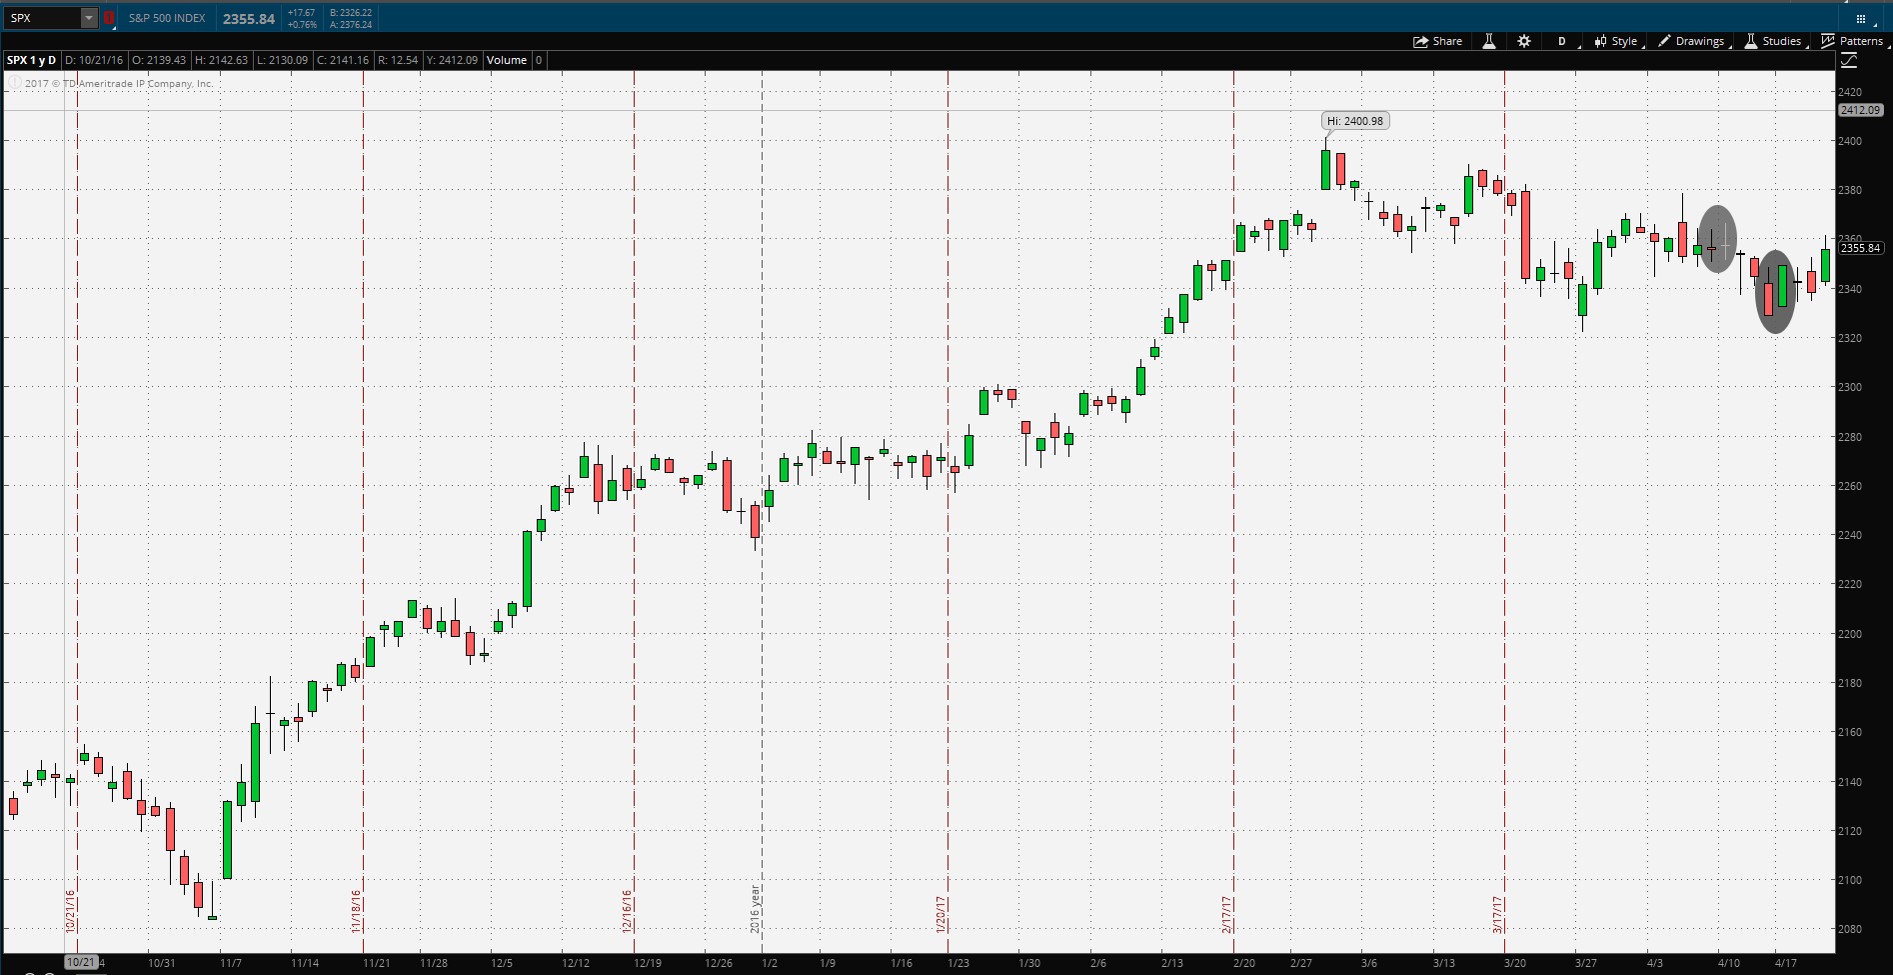
Figure 2: S&P 500 Index (SPX) – Daily Chart.
The first circle represents the time of news reports on U.S. airstrikes on Syrian bases.
The second circle represents the time of news reports on most powerful non-nuclear bomb being dropped in Afghanistan

As you can see in figure 2, the stock market barely reacted to the recent U.S. military actions that Trump gave a green light to.

As a trader and investor, I wouldn’t be concerned about the potential war with North Korea. (Although I would be concerned about the loss of human lives and loss of limbs.)

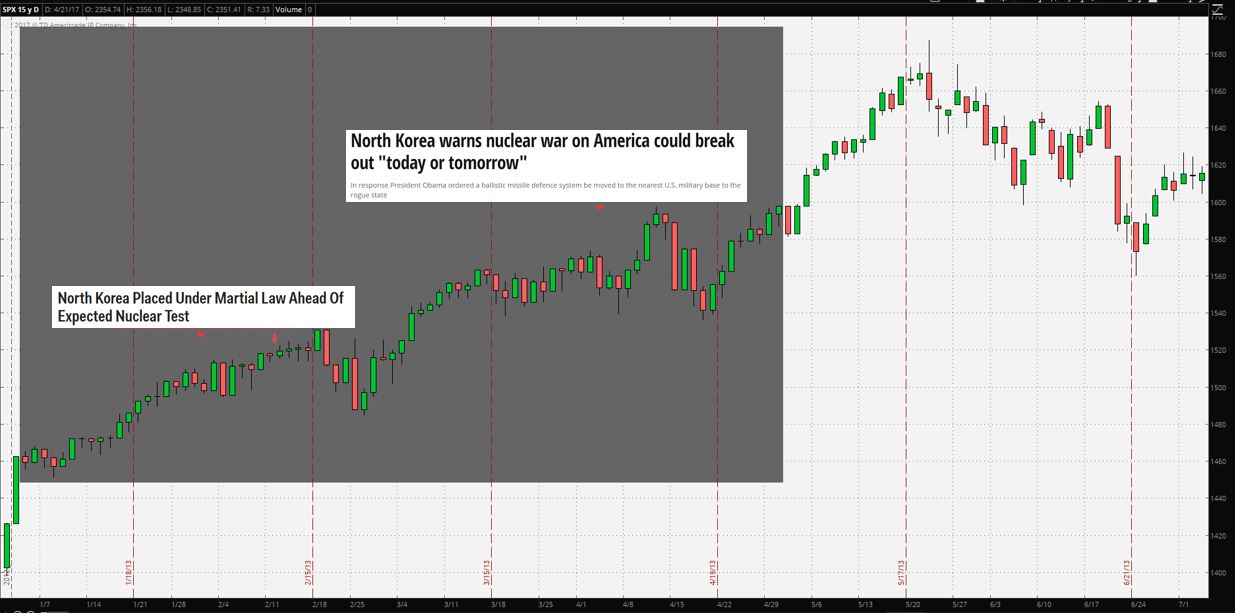
In early 2013, there were increased tensions with North Korea, similar to today. At the time, the stock market did not give a damn about the threats from DPRK.

Figure 3: S&P 500 Index – Daily
The first headline shows two arrows.
The first arrow represents when the headline came out. The second arrow represents February 12 when NK conducted the nuclear test.
The second headline represents North Korea threatening the west as usually.

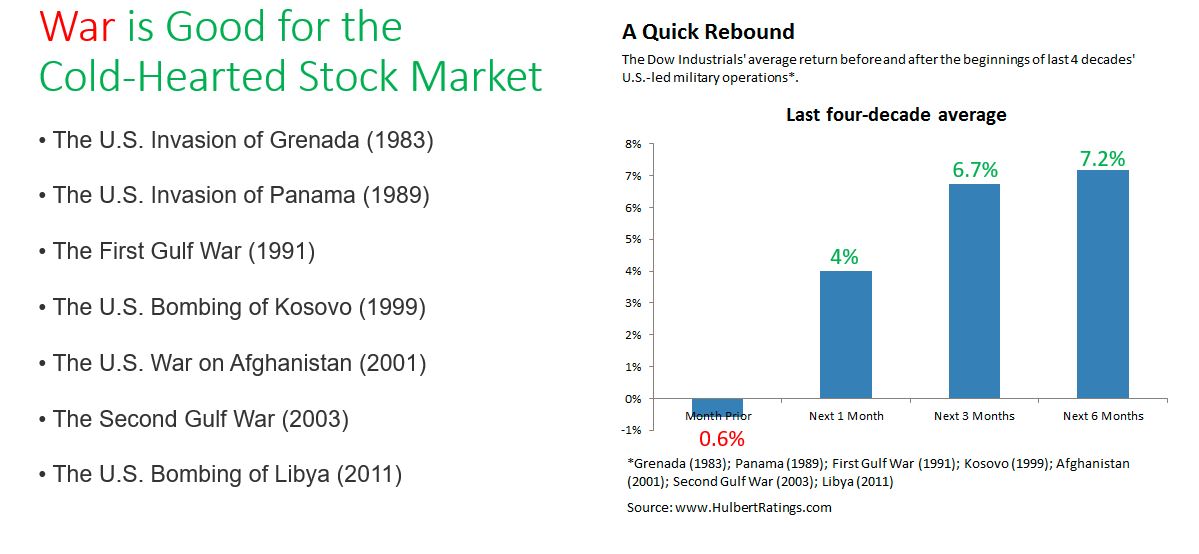
Not only does the stock market not care about North Korea, but also for any other war in the past century. War is good for the cold-hearted stock market.

Over the past 4 decades, Dow Industrials on average was turned on by U.S.-led military operations, returning 4% in a month after the beginning of military operations and more afterward.

Figure 4: War is Good for the Cold-Hearted Stock Market
Recent Three Wars

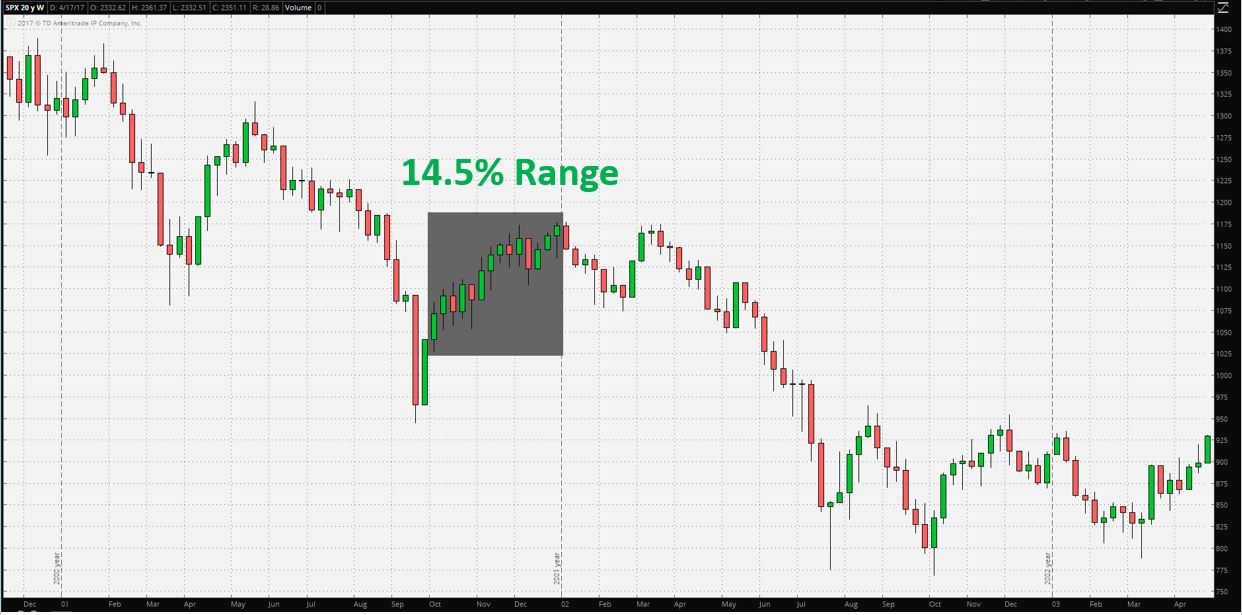
When the U.S., with support from allies, started bombing against Taliban forces in Afghanistan on October 7, 2001, the stock market went up, not down. Even after 12 days later when the first wave of conventional ground forces arrived, the stock market kept going up. By the year-end when Taliban collapsed, S&P 500 was up about 14.5%.

Figure 5: S&P 500’s reaction to the U.S. military action in Afghanistan – Weekly Chart

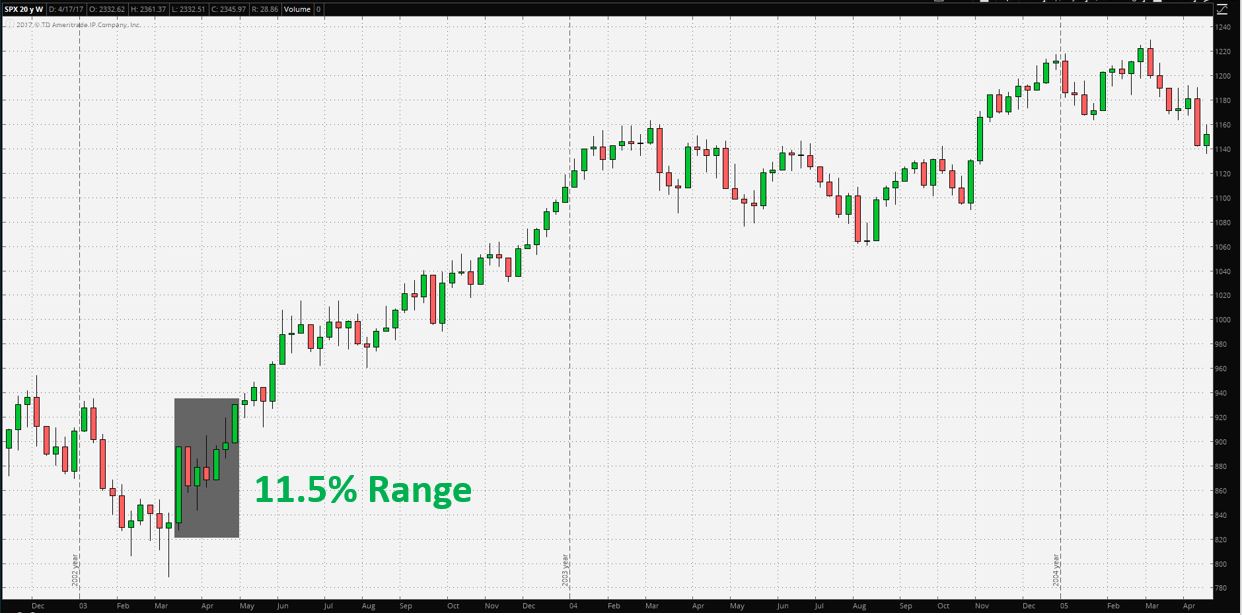
When the U.S. began the major combat operations in Iraq on March 20, 2003, the stock market skyrocketed as shown in the candlestick bar on the highlighted portion of S&P 500 Weekly chart in figure 6 below. By the time the operations ended on May 1, the stock market was up about 11.5%.

Figure 6: S&P 500’s reaction to the U.S. military action in Iraq – Weekly Chart

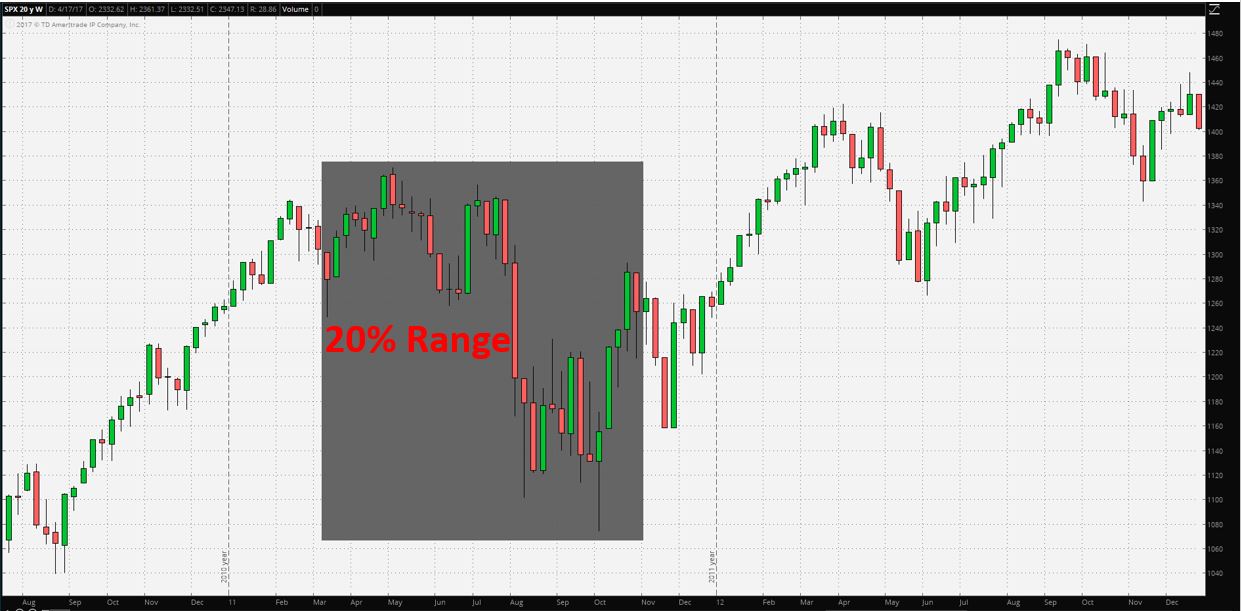
On March 19th of 2011, multiple countries part of NATO intervened in Libya. By the end of intervention on October 31st, the market slid 20%. The drop cannot be blamed on the NATO-led forces. This was due to the fears of contagion of the European debt crisis and first-ever downgrade of U.S. AAA credit rating.

Figure 5: S&P 500 reaction’s to the U.S. military action in Libya – Weekly Chart

The only difference this time is we got leaders who very much loves forces and are violent themselves. Another difference is that North Korea is little powerful today than they were in 2013. But they are very weak compared to China, Russia, Europe, and U.S. It’s better to act now before North Korea gets even stronger. Although lives and limbs will be lost, I think there’s a greater cost if we allow North Korea to get even stronger.

China and North Korea

With China possibly increasingly going against North Korea, Kim Jong-un might act even more violent. I don’t think China really wants to break off its relationship DPKR due to the geographic proximity and China’s willingness to make more friends in the region. Besides being a military and diplomatic ally, China is also an economic ally. In 2015, the second largest economy accounted for 83%, or $2.34 billion, of the North Korea’s exports.

In late February, China sanctioned coal shipments from North Korea, who is a significant supplier of coal. Instead, China has been ordering the coal from the U.S. In the past, Trump said he wants to help the country’s struggling coal sector.

As Reuters reported, Thomson Reuters Eikon data shows “no U.S. coking coal was exported to China between late 2014 and 2016, but shipments soared to over 400,000 tonnes by late February.”

Is China having a change of heart on its relationship with North Korea? I don’t think as China’s trade with North Korea still increased by almost 40% in the first quarter of this year. China also buys other stuff, such as minerals and seafood. Looks like China wants to be on the good side of North Korea and Trump. The Art of the Deal.

Is this time is also different when it comes to the stock market? I don’t believe so. I’m not worried about the negative impact on the stock market due to North Korea, even though they were to be invaded.

However, I’m watching very cautiously China and Russia getting into an armed conflict with the U.S because of the North Korea situation. Armed conflict between the superpowers is a game changer. Although that’s very unlikely as superpowers argue all the time.

Suggestion For Your Portfolio

The situations might affect the markets for a very short period of time, especially if there’s uncertainty. But investors shouldn’t worry about it. The market could care less about a war, specifically when it’s aboard.

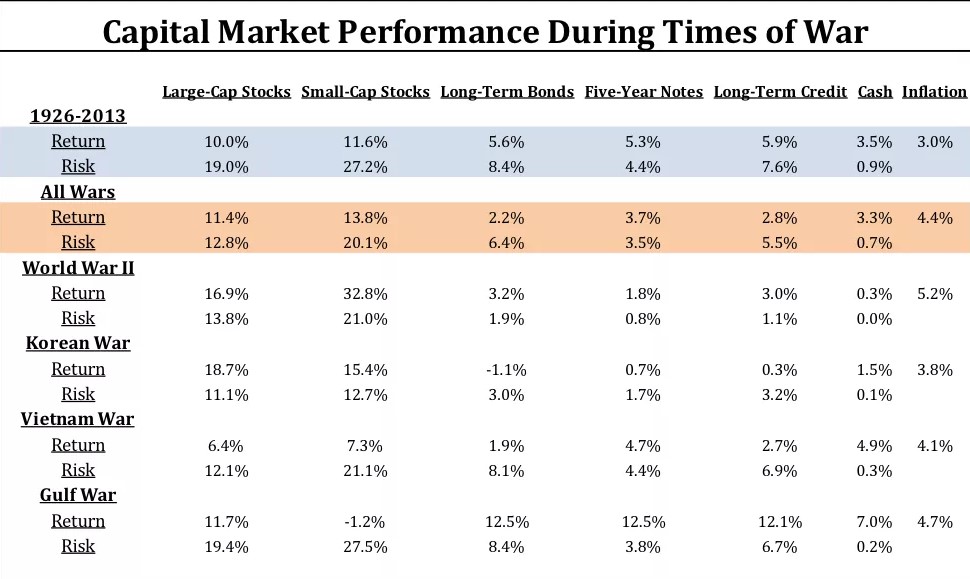
During the times of war, don’t reduce your holdings because of misconception war is bad. If you do, you will miss the gains.

Figure 6: Capital Market Performance During Times of War
Sources: The indices used for each asset class are as follows: the S&P 500 Index for large-Cap stocks; CRSP Deciles 6-10 for small-cap stocks; long-term US government bonds for long-term bonds; five-year US Treasury notes for five-year notes; long-term US corporate bonds for long-term credit; one-month Treasury bills for cash; and the Consumer Price Index for inflation. All index returns are total returns for that index. Returns for a war-time period are calculated as the returns of the index four months before the war and during the entire war itself. Returns for “All Wars” are the annualized geometric return of the index over all “war-time periods.” Risk is the annualized standard deviation of the index over the given period. Past performance is not indicative of future results.